From Engagement to Insight
Visualize Enablr Data in Power BI
Unlock insights from every interaction with Enablr + Power BI. Track content, sales, and engagement – all in one dashboard.
The Enablr Sales platform gives you the power to turn raw engagement data into meaningful, actionable insights—directly within Power BI. With our pre-configured dashboard template and custom connector, your team can explore, customize, and visualize every interaction across your CLM ecosystem.
This setup offers complete flexibility to:
Track rep activity, content usage, and customer engagement.
Measure the performance of your digital detailing assets.
Analyze multi-channel interactions and sales effectiveness.
Build tailored dashboards aligned with your business goals.
Whether you’re a marketer tracking campaign effectiveness or a sales leader optimizing rep performance, Enablr + Power BI puts data-driven decision-making in your hands – no coding or complex setup required.
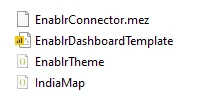
Save the EnablrConnector.mez file (shared by your administrator or project manager) to the following location on your computer:
Documents > Power BI Desktop > Custom Connectors
📌 Note: If the Power BI Desktop or Custom Connectors folder doesn’t exist, you’ll need to manually create them. (Please refer image 1)
Image 1
3. Enable Custom Data Extensions in Power BI
To enable custom connectors, follow these steps:
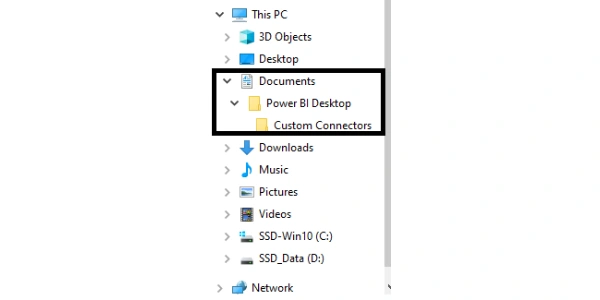
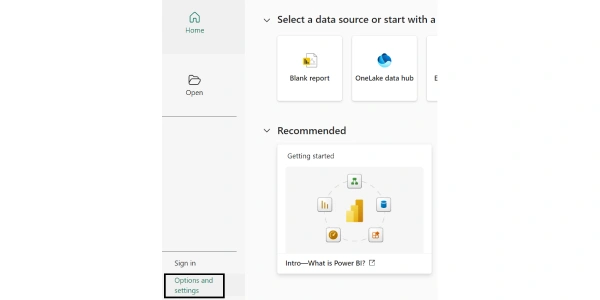
Open Power BI Desktop.
Go to File > Options and settings > Options. (Please refer image 2 & 3)
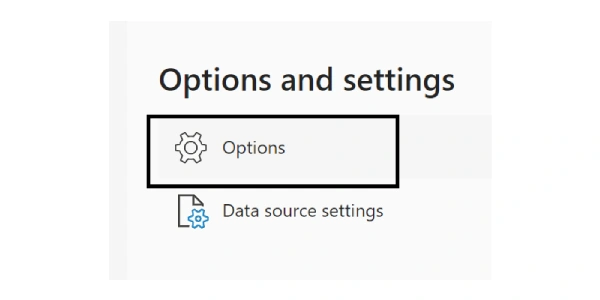
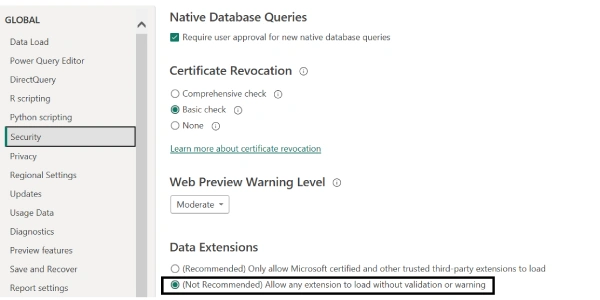
Under the Security section, scroll to Data Extensions.
Select the option: ✔ Allow any extension to load without validation or warning. (Please refer image 4)
Restart Power BI Desktop for the changes to take effect.
Image 2
Image 3
Image 4
4. Open the Enablr Power BI Template
Locate and open the template file named: EnablrDashboardTemplate.pbix This file serves as your report template with pre-configured visuals and queries.
5. Configure the Data Source with Your Organization’s Key
If you have not received your organization key, please send an email to support@enablrsales.com
Follow these steps to connect the template to your organization’s data:
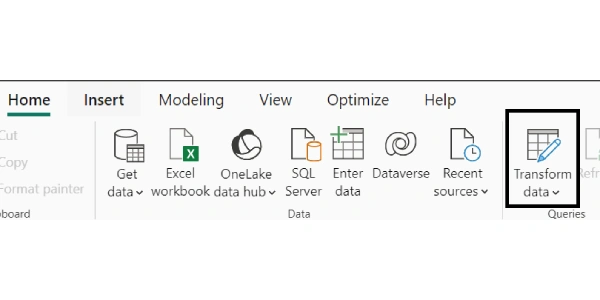
After opening the file, go to the Home tab and click on Transform Data. (Please refer image 5)
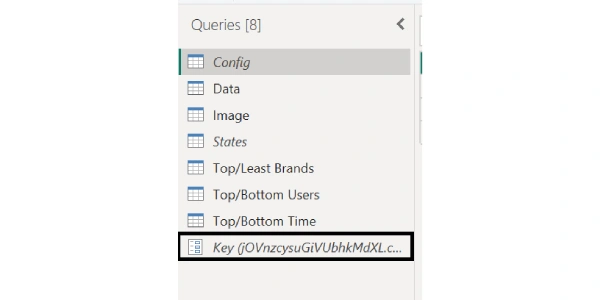
In the Power Query Editor, locate the Key (Parameter) in the left-side pane.
Replace the default key with the one provided by your organization. (Please refer image 6)
Image 5
Image 6
6. Refresh and Load the Data
Once you’ve entered the correct key:
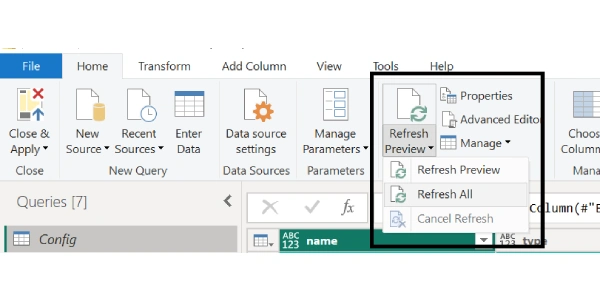
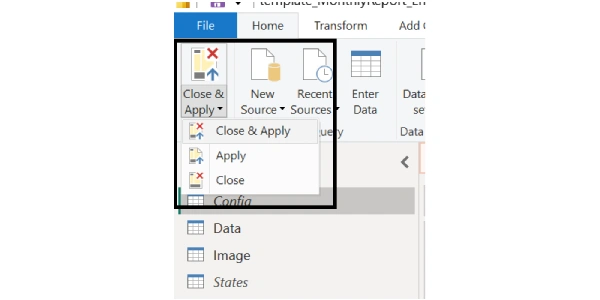
From the top menu, click Refresh Preview > Refresh All to manually refresh the queries and preview updated data. (Please refer image 7) Then click Close & Apply to load the data into Power BI. (Please refer image 8)
Your dashboard will now reflect real-time organizational data.
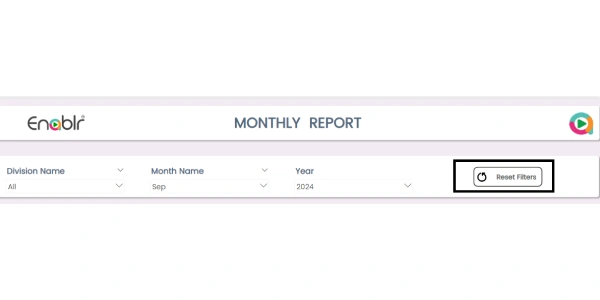
🧹 Tip: Use Ctrl + Click on filters to reset them as needed. (Please refer image 9)
Image 7
Image 8
Image 9
Supercharge your sales strategy and start making more informed, impactful decisions with the Power BI integration on EnablrSales. From real-time dashboards to deep-dive analytics, empower your team with the insights they need to close deals faster and smarter. No more guesswork—just clear, data-backed decisions that drive growth. Start unlocking the full potential of your sales data today with Power BI and EnablrSales working together.
🛠️ Troubleshooting Common Issues
If the dashboard fails to load or shows errors, try the following:
Close Power BI Desktop completely.
Reopen the application and repeat the configuration steps.
Note: There might be slight differences in the layout or appearance of the report depending on your version of Power BI. If display issues occur, close and reopen the file.
⚠️ Important Limitations of Power BI Desktop (Free Version)
🔄 Manual Data Refresh Only: Automatic or scheduled refresh is not supported.
📤 No Online Publishing or Sharing: Reports cannot be shared via the Power BI Service.
🤝 No Collaboration Features: Shared workspaces, app deployment, and report distribution are not available.
💡 Consider Upgrading to Power BI Pro or Premium
To unlock advanced features and enterprise-grade reporting, consider upgrading to a paid Power BI license:
✅ Scheduled and automated data refresh.
✅ Secure report publishing and sharing.
✅ Collaboration through shared workspaces and apps.